

The 5,000-Mile Salad
Lettuce from Spain, avocados from Mexico, pomegranates from Israel—all arrive for your dining pleasure
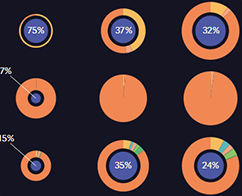
Click on the blue buttons below to see where more than 150 fruits and vegetables come from. “Origin of imports” shows imports for April and September of each year. “Volume” shows metric tonnage produced inside and outside the U.S. “Change over time” shows the rise and fall of these metrics over time. A few sample searches are shown at right.
Find your fruits and vegetables, share your discoveries
- Origin of imports

- Volume

- Change over time

Research and interactive graphics by The Office for Creative Research
SOURCE: U.S. Department of Agriculture’s Agricultural Marketing Service; Data represent shipments to U.S. regional distribution centers; Local farm sales are not included.
Just a taste of the data...


Change over time

Yearly view
Monthly view
*Monthly domestic data for Garlic is not available.
Slide tab

-
Domestic
Canada - Europe
- Middle East
- Asia
-
Pacific
Australia - Africa
- South America
-
Central America
Mexico
Volume

- 1998
- 1998
- 1998
195.3K
metric tons
metric tons
195.3K
metric tons
metric tons
195.3K
metric tons
metric tons
195.3K
metric tons
metric tons
195.3K
metric tons
metric tons
195.3K
metric tons
metric tons
195.3K
metric tons
metric tons
195.3K
metric tons
metric tons
195.3K
metric tons
metric tons
Slide tab
-
Domestic
Canada - Europe
- Middle East
- Asia
-
Pacific
Australia - Africa
- South America
-
Central America
Mexico
Origin of imports

Slide tab
-
Domestic
Canada - Europe
- Middle East
- Asia
-
Pacific
Australia - Africa
- South America
-
Central America
Mexico